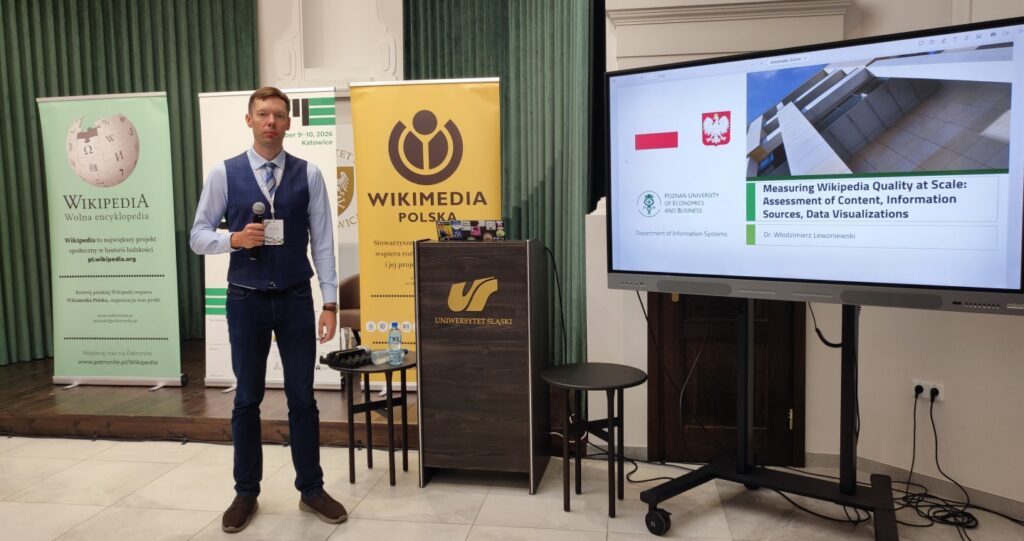
At the international conference “Open Knowledge: Wikimedia & Research in the CEE Region”, held on October 9–10, 2026, in Katowice, Dr. Włodzimierz Lewoniewski delivered a talk entitled “Measuring Wikipedia Quality at Scale: Assessment of Content, Information Sources, Data Visualizations”. The presentation focused on the use of artificial intelligence and advanced data analysis methods to automatically assess the quality of information on Wikipedia.
Wikipedia contains more than 65 million articles in over 300 languages. This enormous scale makes the traditional manual assessment of all its content virtually impossible. Computational methods, including machine learning, natural language processing, and artificial intelligence models, offer a way to address this challenge.
During the presentation, Dr. Włodzimierz Lewoniewski shared findings from a series of studies conducted at the Department of Information Systems on the automated quality assessment of Wikipedia articles, including their neutrality, completeness, structure, and information sources. Topics included sentiment analysis of nearly 7 million English Wikipedia articles, research into networks of links between articles, and methods for comparing content quality across different language editions. Special attention was given to the assessment of data visualizations, such as maps, charts, tables, and diagrams. The research presented covered more than half a million visualizations from Polish Wikipedia, examining their readability, visual characteristics, and how they present information. Another important topic was the reliability of information sources. By analyzing millions of bibliographic references, researchers can identify the most frequently used websites and examine their importance across different subject areas and Wikipedia language editions.
A new online service, Wikipedia-Map.net, was also introduced during the presentation. This publicly accessible tool allows users to explore Wikipedia as an interactive map of interconnected articles. The visualization makes it possible to examine Wikipedia’s structure, discover connections between topics, and analyze the popularity and quality of individual articles. Through its interactive interface, users can observe how different areas of knowledge are connected, forming an extensive network of information. Wikipedia-Map.net demonstrates how scientific research findings can be applied in practice to develop tools that provide deeper insights into the structure and evolution of open knowledge resources.
The studies presented demonstrate how combining artificial intelligence, network analysis, natural language processing, and data visualization can support the development of Wikipedia and other open knowledge ecosystems. The presentation also highlighted challenges related to AI model selection, differences between languages, and the interpretation of automatically generated quality metrics. The methods being developed may find applications not only in assessing encyclopedic content but also in search engines, artificial intelligence systems, educational platforms, and other solutions that rely on open information resources.
The presentation is available on the website of the “Open Knowledge: Wikimedia & Research in the CEE Region” conference and on Figshare.